Dashboard walkthrough
Every panel on this dashboard comes from the same test program — company-lookup.ts, sovdev-logger's reference E2E scenario. This page walks through the dashboard top to bottom, pairing each panel with the exact sovdev_log*() call that produced it — real screenshots, real code, no invented examples.
Try it yourself
This reproduces the exact run behind the screenshots below, using the sovdev-logger repo's own DevContainer and local UIS (Loki/Prometheus/Tempo/Grafana) stack — not something available from just installing the published package. See Environment configuration for that setup. If you're only using the library in your own application, skip to the panel explanations below — they apply just as well to a dashboard you build against your own Grafana.
dct-exec bash -c "cd /workspace/typescript/test/e2e/company-lookup && bash run-test.sh --skip-validation"
Then open the dashboard (this is the one built and pushed in tools/dashboards/, not the UIS-provisioned one — see Observability architecture for that one):
http://grafana.localhost/d/sovdev-logger-full/sovdev-logger-full-overview
Traces take 20-40 seconds to become searchable after a run (a Tempo indexing characteristic, not a bug) — if the Recent Traces panel is empty right after running the test, wait a bit and refresh.
The scenario
company-lookup.ts's main() looks up 4 Norwegian organizations from the Brønnøysund Registry (BRREG), one of which is intentionally invalid to demonstrate error handling:
const companies = [
  '971277882', // Norges Røde Kors (Norwegian Red Cross)
  '915933149', // Røde Kors Hjelpekorps (Red Cross Rescue Corps)
  '974652846', // INVALID - Will cause error (demonstrates error handling)
  '916201478'  // Norsk Folkehjelp (Norwegian People's Aid)
];
Everything below comes from this one run.
Active Integrations, Total Operations, Error Rate, Avg Duration
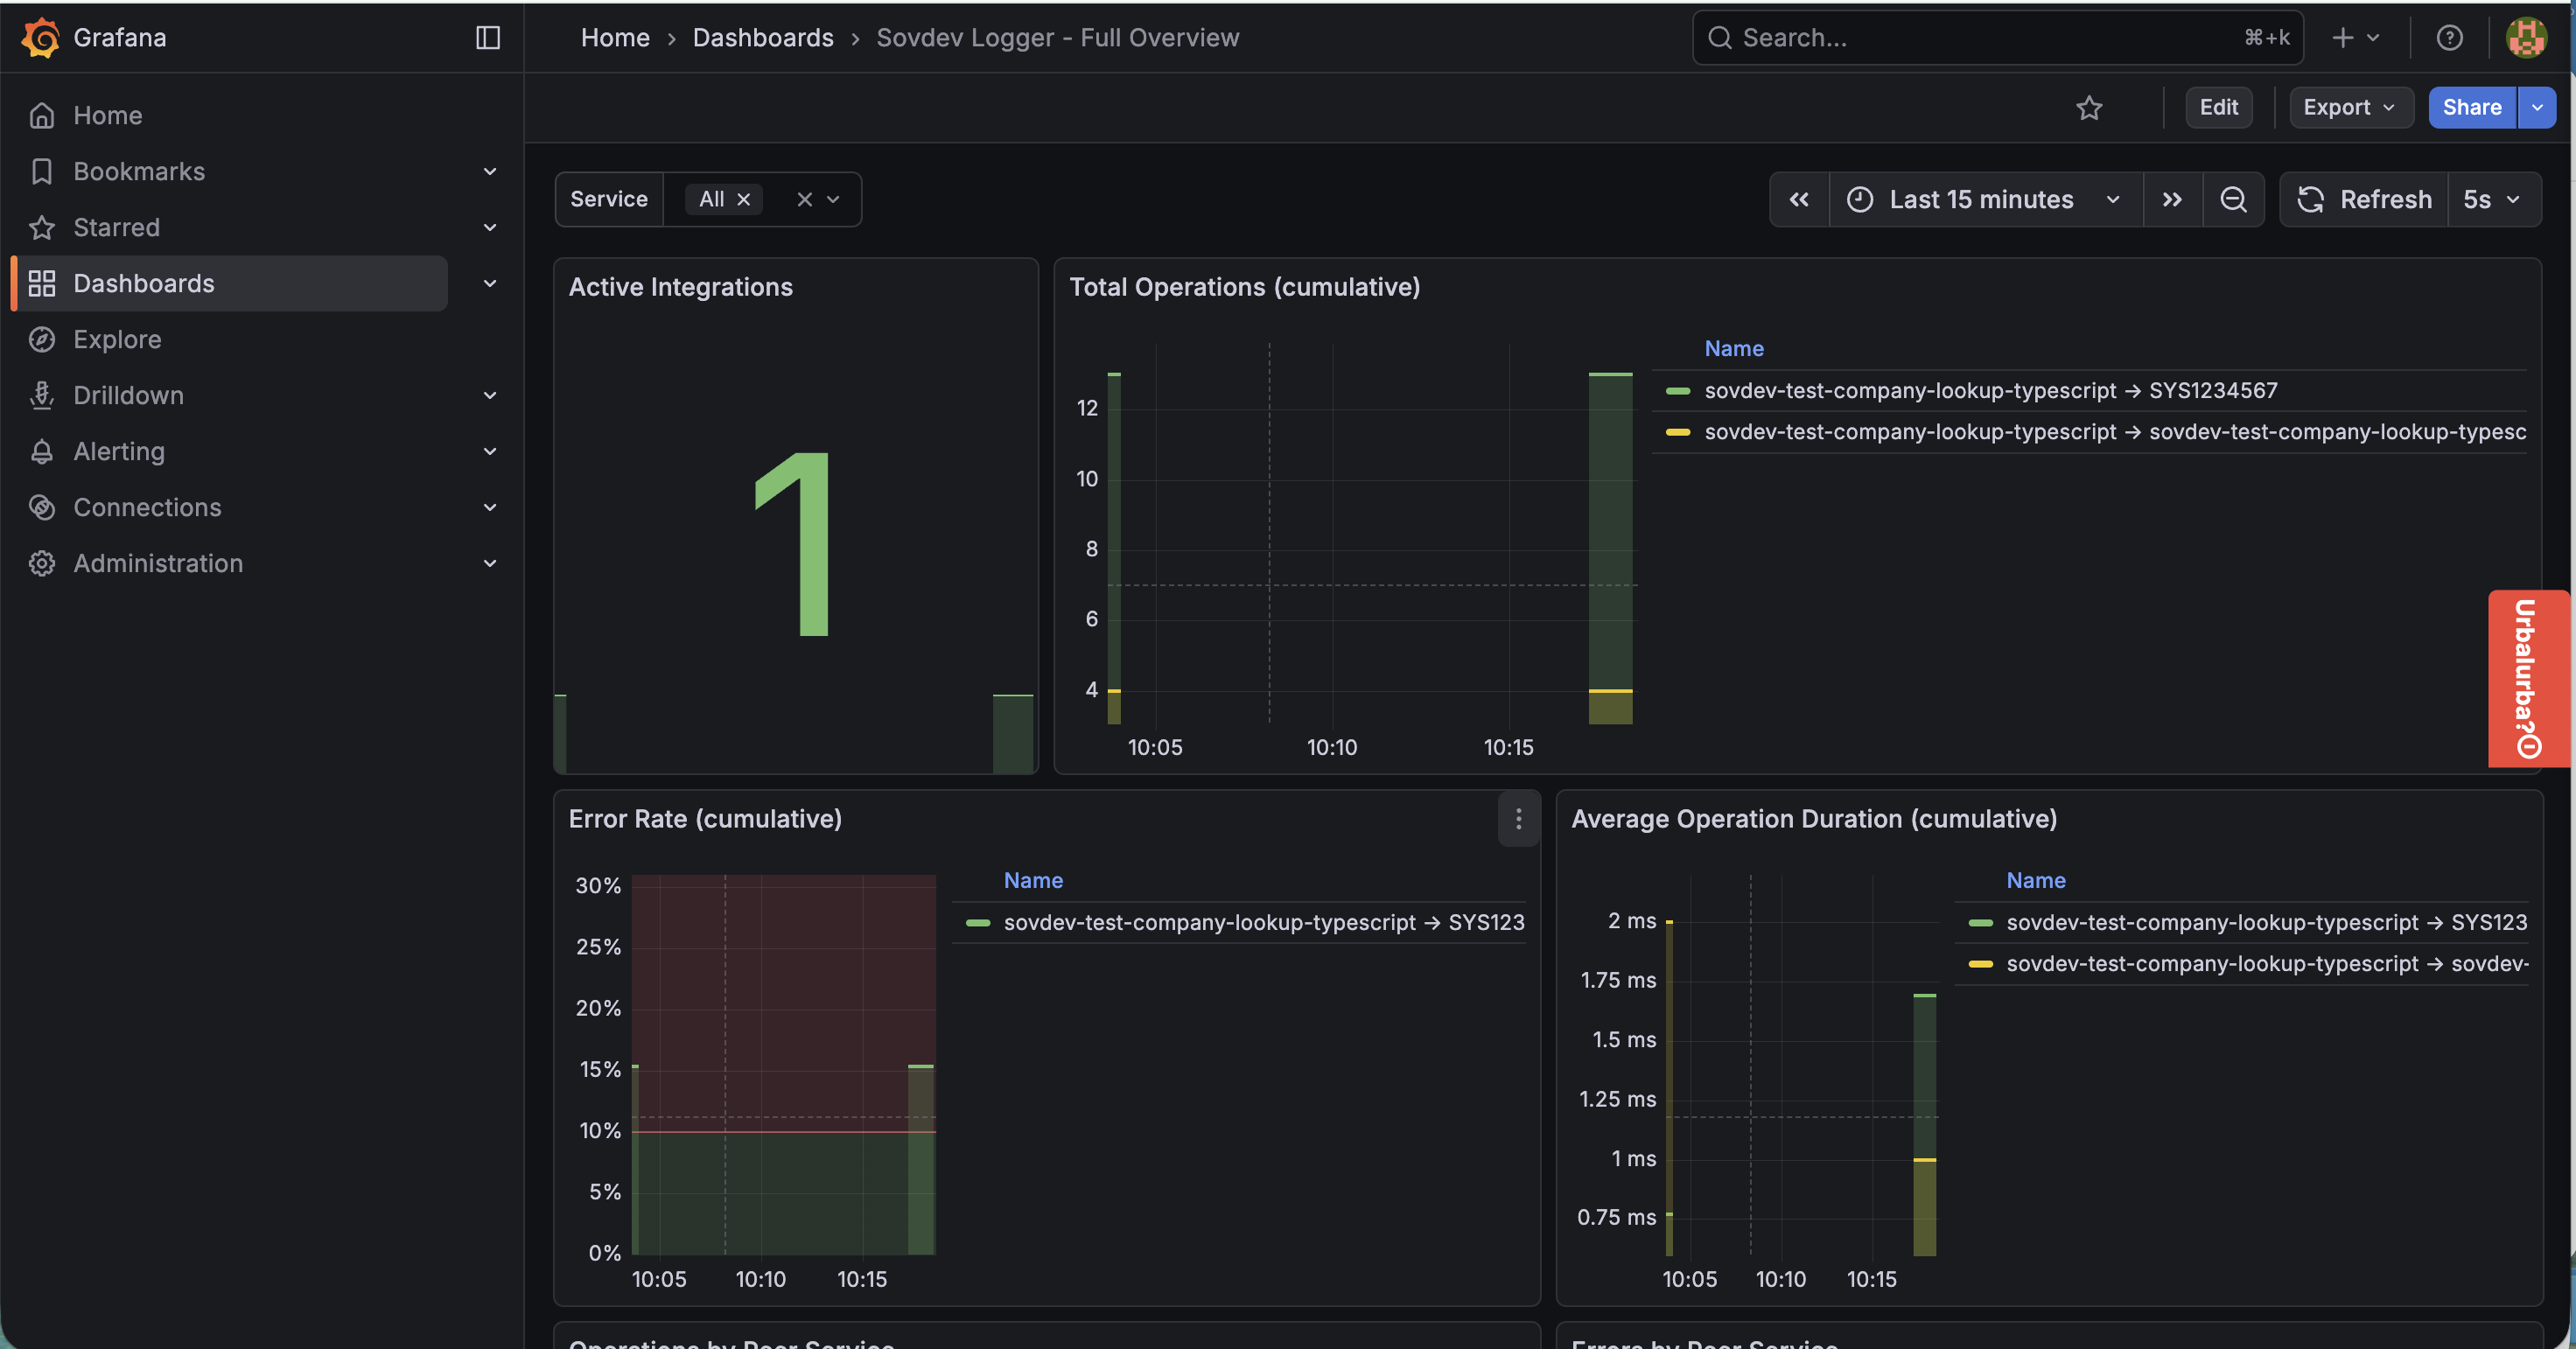
These four panels are automatic — there's no separate metrics code anywhere in company-lookup.ts. Every sovdev_log() call generates sovdev_operations_total, sovdev_errors_total, and sovdev_operation_duration_milliseconds behind the scenes, labeled by service_name and peer_service. Write one log call, get a counter, an error counter, and a duration histogram for free — this is the "one log call, complete observability" idea the library is built around.
Each panel breaks its metric down by (service_name, peer_service) and renders every combination via its table-mode legend ({{service_name}} → {{peer_service}}) — this is sovdev-logger's service-dependency data. The SYS1234567 you see there is BRREG's system ID, passed as PEER_SERVICES.BRREG to every sovdev_log() call inside lookupCompany():
const PEER_SERVICES = create_peer_services({
  BRREG: 'SYS1234567'  // Norwegian company registry (Brønnøysundregistrene)
  // INTERNAL is auto-generated with value 'internal'
});
sovdev_log(
  SOVDEV_LOGLEVELS.INFO,
  FUNCTIONNAME,
  `Looking up company ${orgNumber}`,
  PEER_SERVICES.BRREG,   // <- this is the label these panels break down by
  input,
  null,
  null
);
That single argument is what lets sovdev-logger build a dependency map automatically — every external system your service calls shows up here, broken out from your service's own internal operations, with no extra instrumentation. (The code comment above says PEER_SERVICES.INTERNAL is 'internal' — that's stale. It actually resolves to your own service_name, which is what you'll see as the peer_service value on the Job Lifecycle panel's "Job Completed" entry below.)
(An earlier version of this dashboard also had 4 separate "by Peer Service" Stat panels doing this same breakdown a second way — removed 2026-07-13 as redundant with what's shown here, and because they carried a maxDataPoints: 1 sampling fragility these table-mode panels don't have.)
Job Lifecycle (Status + Progress)
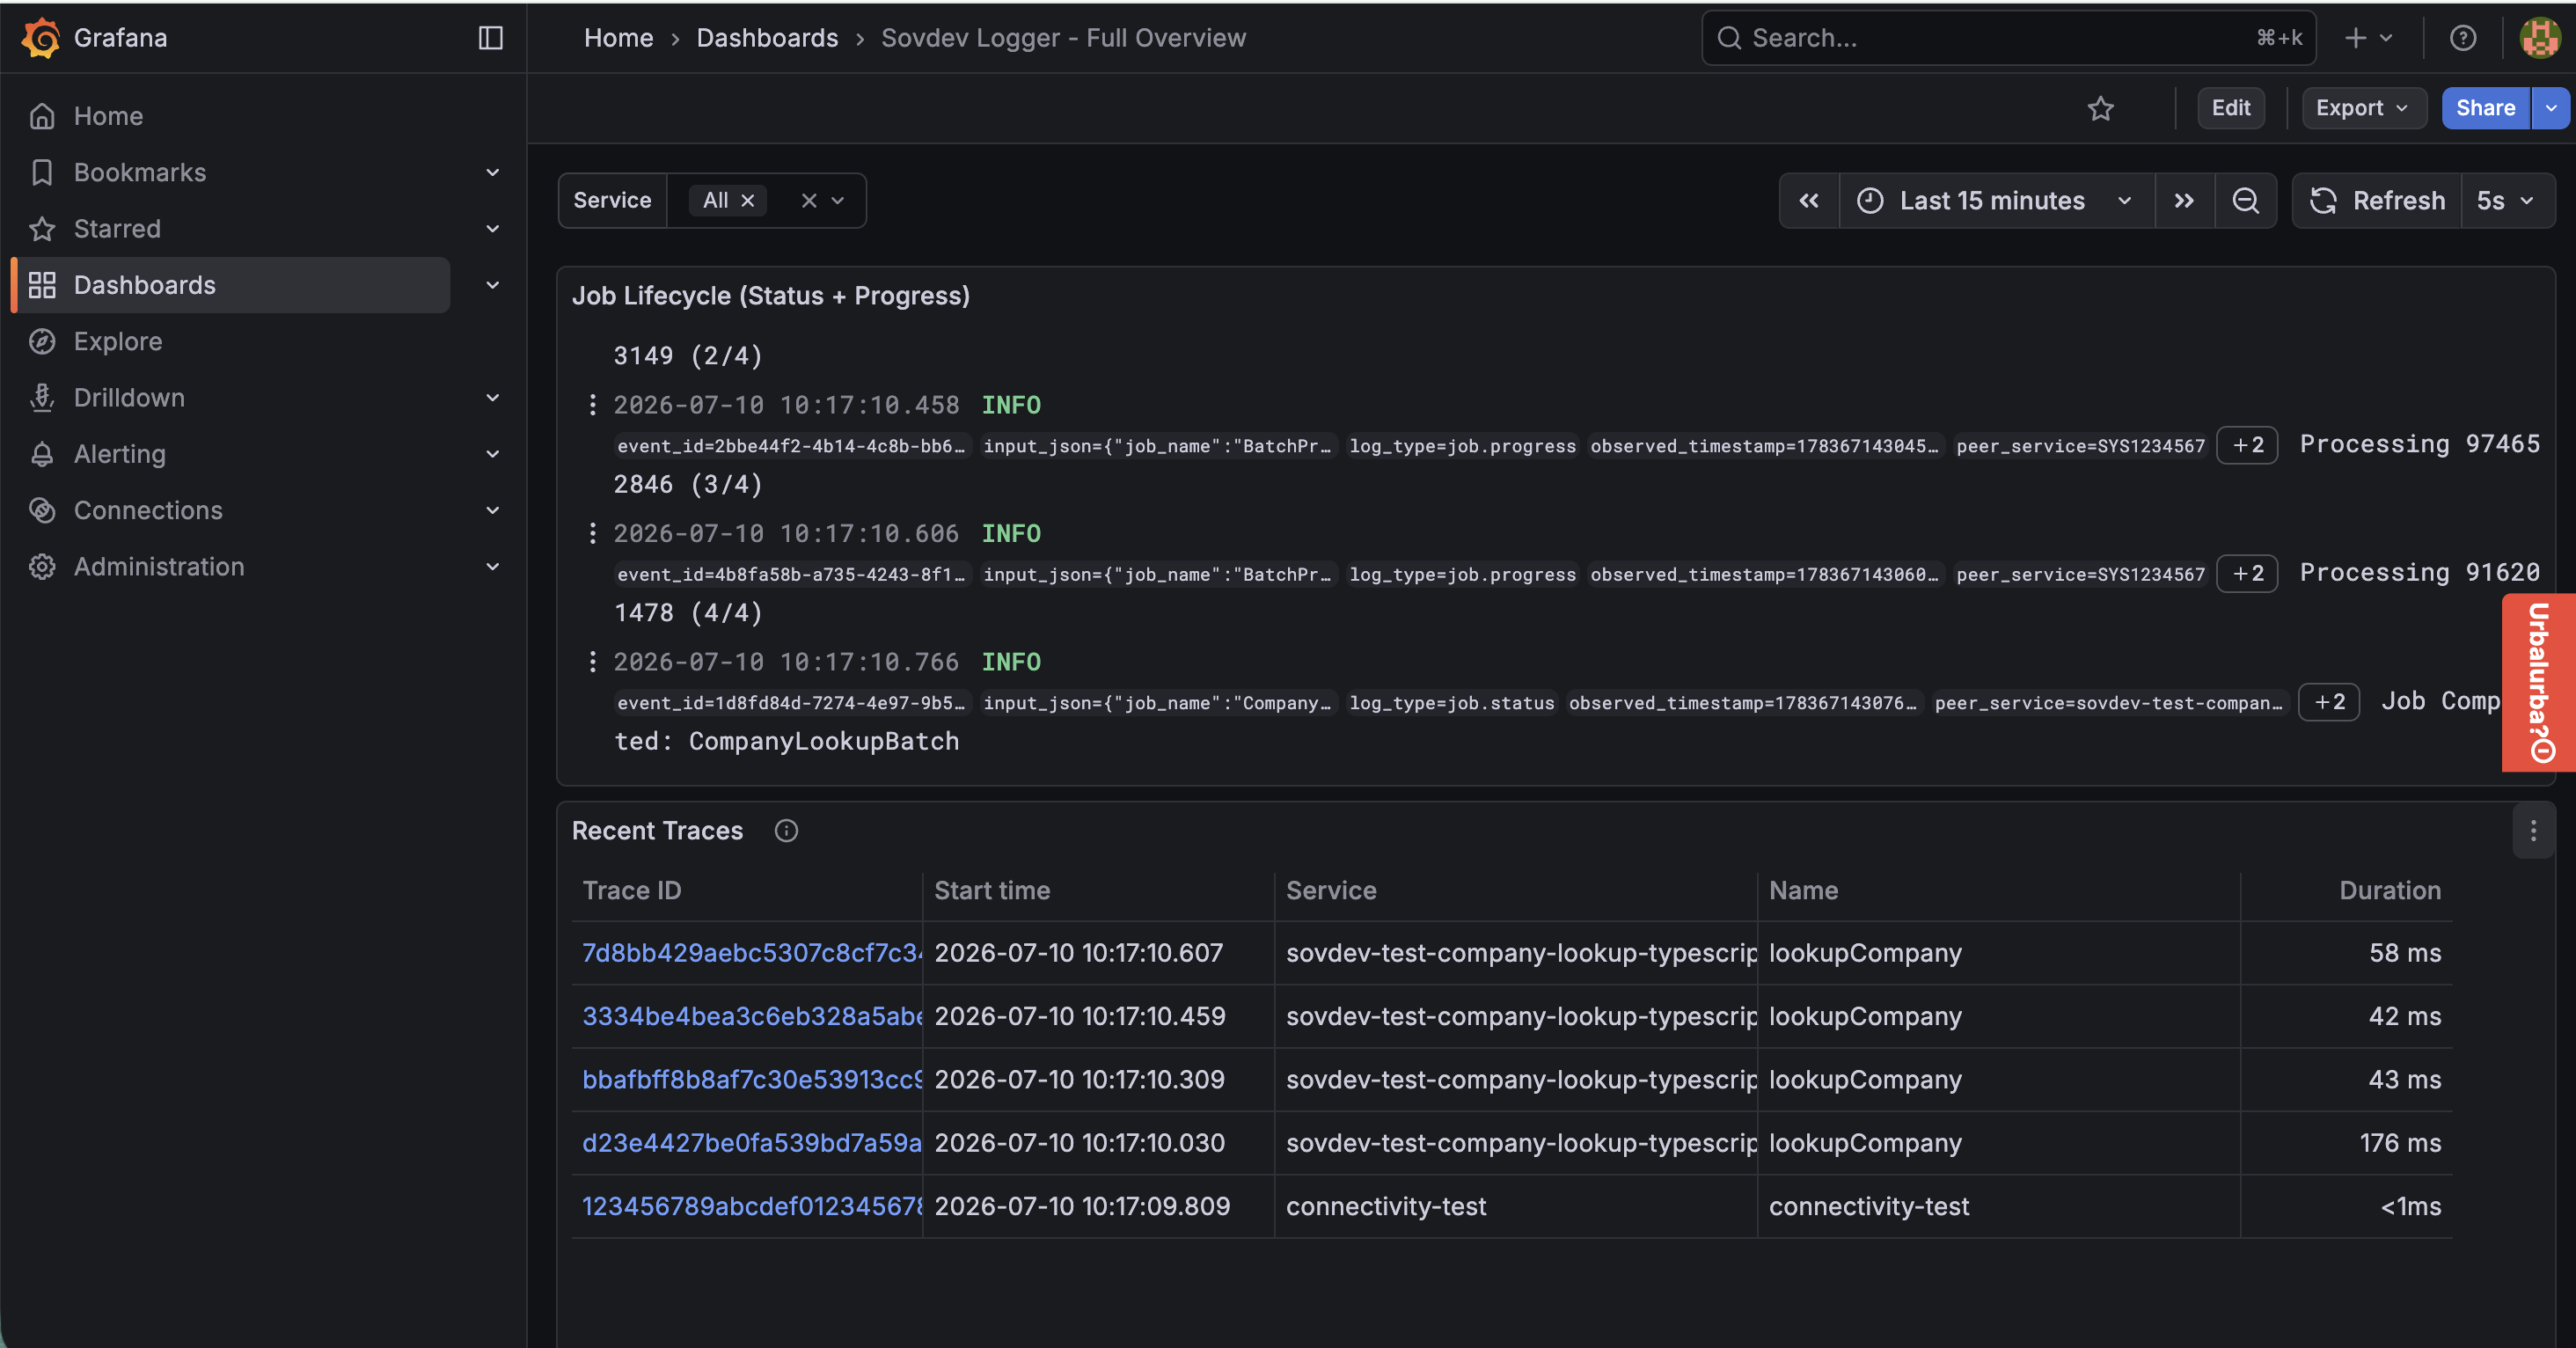
Batch jobs get their own log type, tracked with two dedicated functions. sovdev_log_job_status() marks the start and end of the whole batch:
sovdev_log_job_status(
  SOVDEV_LOGLEVELS.INFO,
  FUNCTIONNAME,
  jobName,              // 'CompanyLookupBatch'
  'Started',            // job lifecycle state
  PEER_SERVICES.INTERNAL,
  jobStartInput          // { totalCompanies: 4 }
);
sovdev_log_job_progress() logs one entry per item as the batch processes:
sovdev_log_job_progress(
  SOVDEV_LOGLEVELS.INFO,
  FUNCTIONNAME,
  orgNumber,          // Item name (what we're processing)
  i + 1,              // Item number (current position, 1-based)
  orgNumbers.length,  // Total items (batch size)
  PEER_SERVICES.BRREG,
  progressInput
);
Both set log_type automatically (job.status / job.progress) — this panel filters on log_type=~"job.status|job.progress" and shows them in chronological order, so the whole lifecycle reads top to bottom: Started → Processing 1/4 → 2/4 → 3/4 → 4/4 → Completed.
Recent Traces
Distributed tracing here needs zero OpenTelemetry imports. lookupCompany() starts a span once, and every sovdev_log() call inside it automatically inherits the same trace_id/span_id:
const span = sovdev_start_span(FUNCTIONNAME, input);

try {
  sovdev_log(/* ... start ... */);
  const companyData = await fetchCompanyData(orgNumber);
  sovdev_log(/* ... success ... */);
  sovdev_end_span(span);
} catch (error) {
  sovdev_log(/* ... error, with the exception ... */);
  sovdev_end_span(span, error);   // marks the span as failed
  throw error;
}
Each of the 4 lookupCompany calls produces one trace here, including the failed lookup (974652846) — it's not excluded just because it errored. Click its Trace ID to open the full waterfall, where the failing span is marked in red.
Recent Errors / Transaction Logs
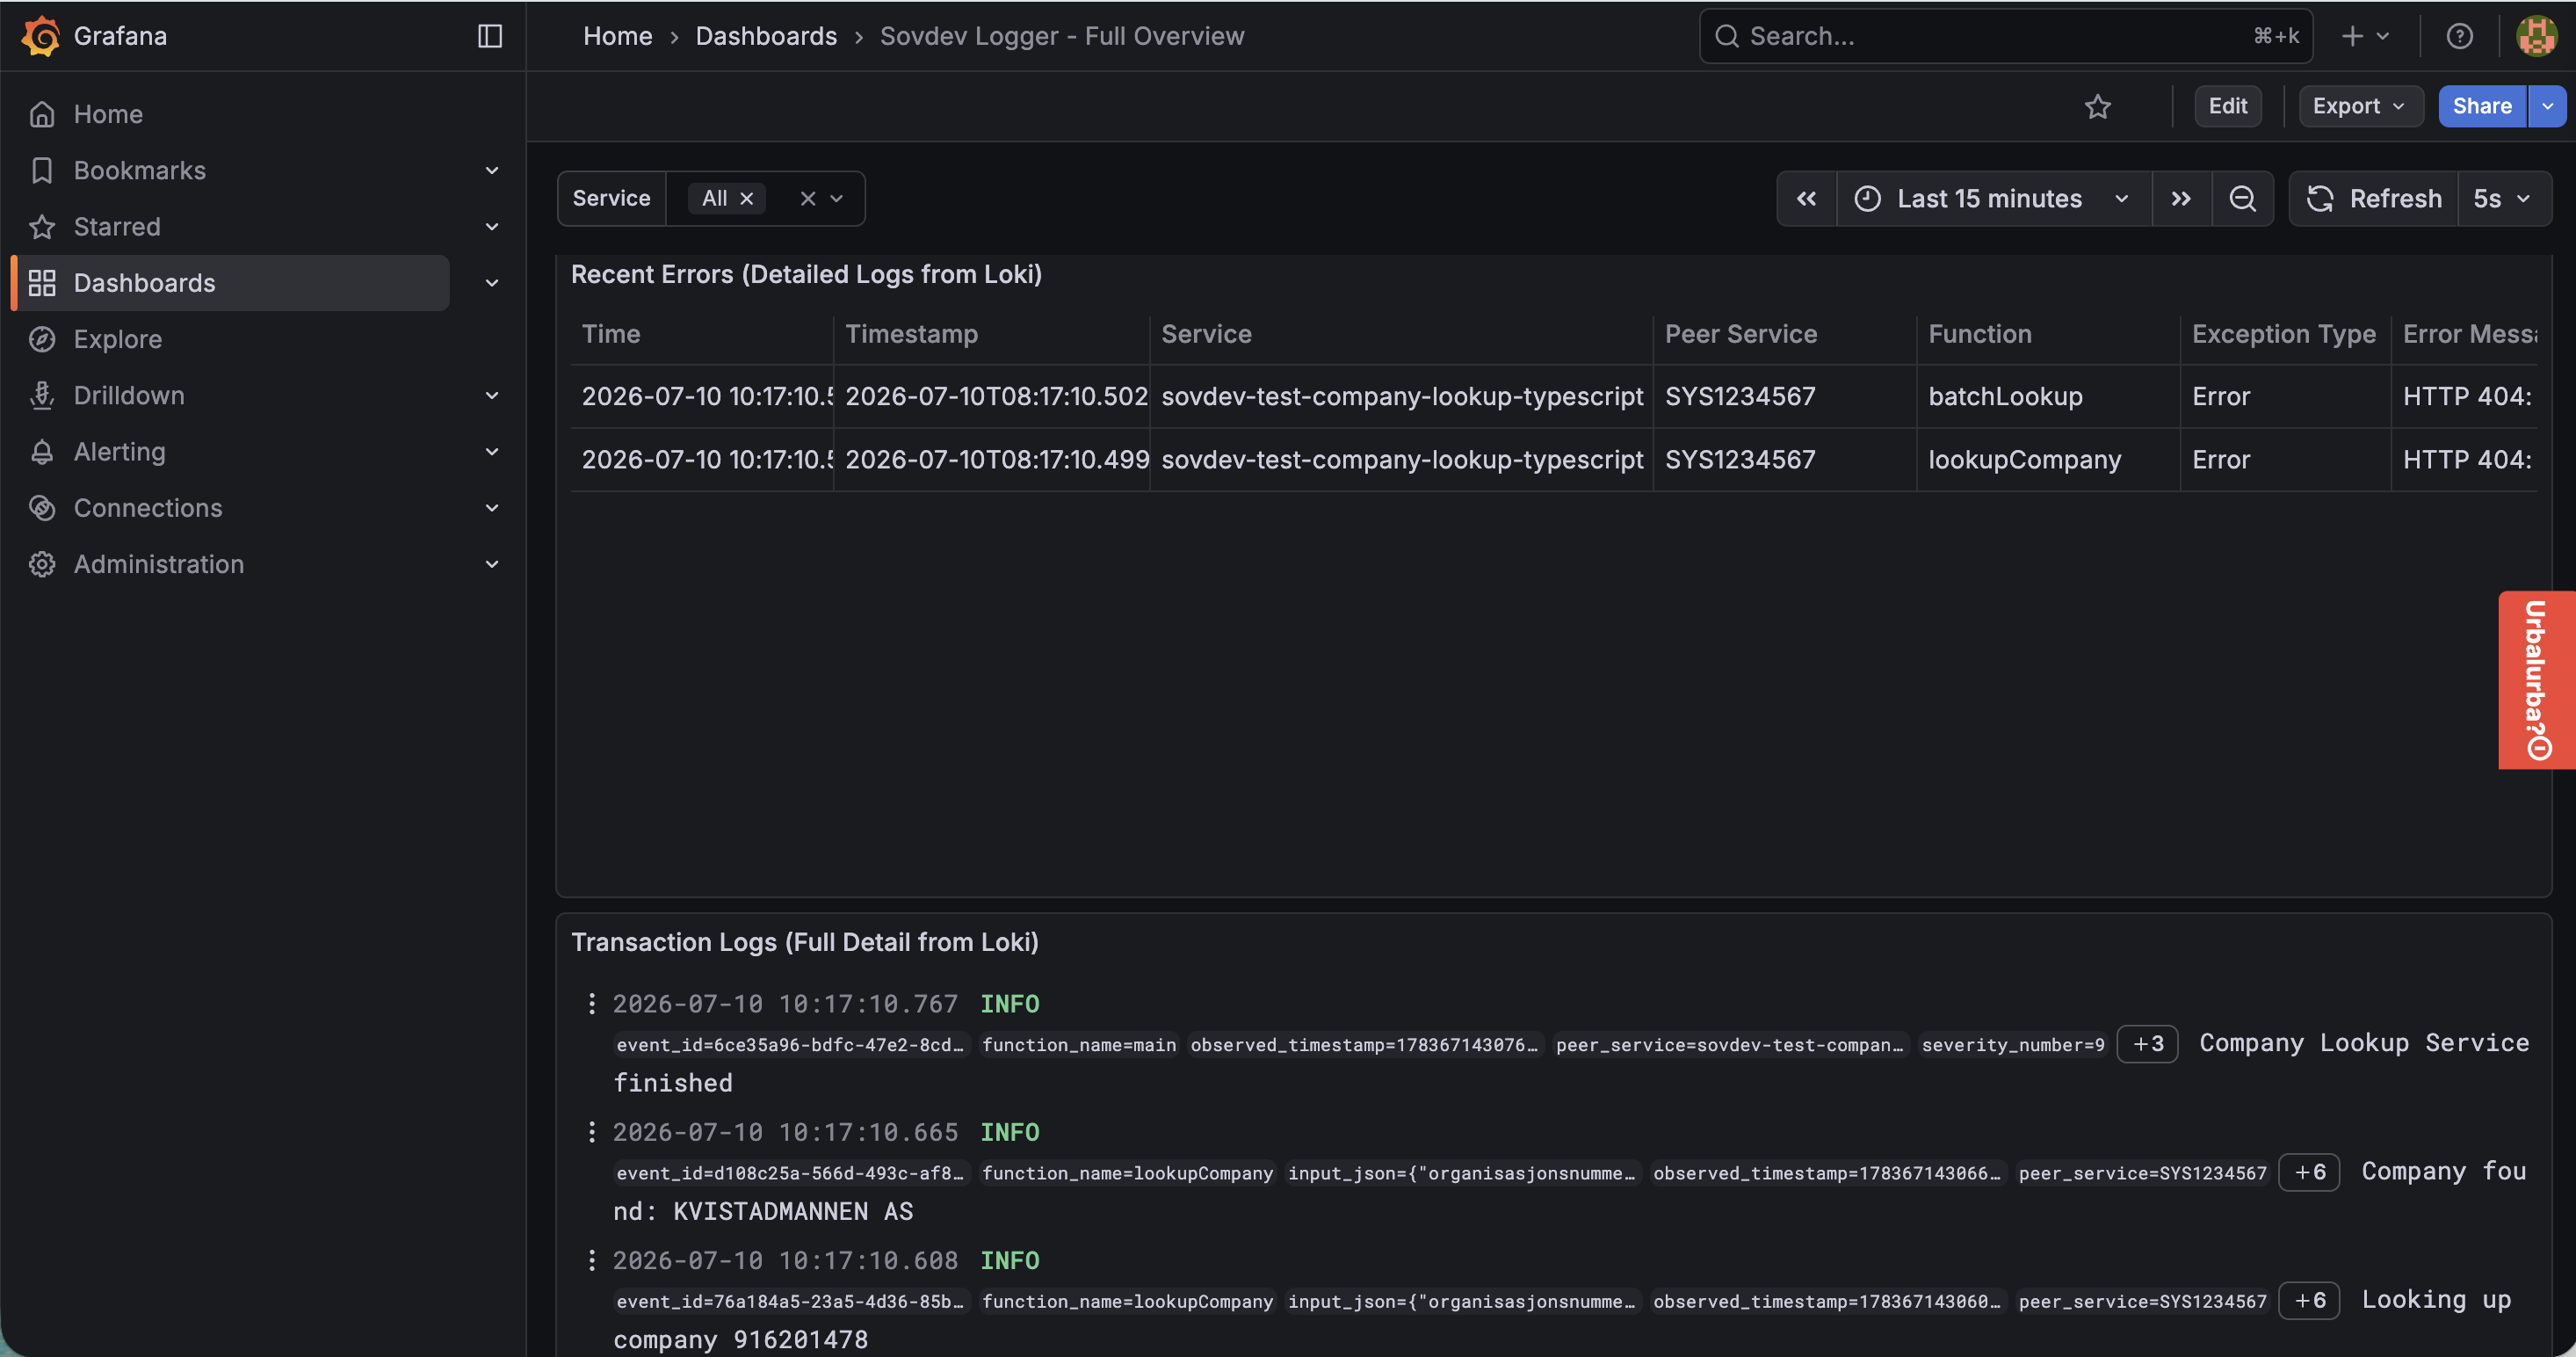
The intentional failure (org number 974652846, which doesn't exist in BRREG) produces sovdev-logger's error path — sovdev_log() at ERROR level with the caught exception passed as the last argument:
sovdev_log(
  SOVDEV_LOGLEVELS.ERROR,
  FUNCTIONNAME,
  `Failed to lookup company ${orgNumber}`,
  PEER_SERVICES.BRREG,
  input,
  null,      // no response on error
  error      // <- sovdev-logger extracts exception_type/message/stacktrace from this
);
sovdev-logger turns that error argument into exception_type (the thrown value's own constructor name, falling back to "Error" if it doesn't have one — that fallback is what you'll see here, since BRREG's 404 surfaces as a plain Error), exception_message, and a cleaned, credential-stripped exception_stacktrace (capped at 350 characters) — visible as separate columns in the Recent Errors table, filtered to exception_type!="".
That's why the Recent Errors table shows two rows, not one, for a single failed lookup: lookupCompany logs the error above, and the batch loop that calls it (FUNCTIONNAME = 'batchLookup') catches it separately to record which item number failed, without stopping the rest of the batch:
} catch (error) {
  failed++;
  sovdev_log(
    SOVDEV_LOGLEVELS.ERROR,
    FUNCTIONNAME,   // 'batchLookup', not 'lookupCompany' — a different vantage point on the same failure
    `Batch item ${i + 1} failed`,
    PEER_SERVICES.BRREG,
    { organisasjonsnummer: orgNumber, itemNumber: i + 1 },
    null,
    error
  );
}
Transaction Logs is everything else: every sovdev_log() call defaults to log_type: "transaction" unless you're using the job-tracking functions above. This panel shows the full, unfiltered detail — request, response, exception, trace correlation, all of it — for every transaction in the run.
See also
Push this dashboard to your own Grafana instance:
cd tools/dashboards
GRAFANA_URL=http://grafana.localhost GRAFANA_USER=admin GRAFANA_PASSWORD=<your-password> npx tsx push-dashboard.ts
tools/dashboards/README.md— complete tool reference (all env vars, the trace-correlation script, file layout)- Observability architecture — the separate, UIS-provisioned testing dashboards
- Log data structure — the full field reference