Onboarding a new system
This is the recipe for connecting a new application to the shared Grafana Cloud stack sovdev-logger's own dashboard already reads from — written once so the third, tenth, or hundredth system to onboard doesn't need to re-derive it.
The principle
Why Consistent Logging Across Systems makes the case for one schema across every system. The Grafana Cloud side of that is: one stack, one dashboard — but not one shared credential. Every system gets its own OTLP ingest token, scoped write-only to that stack, independently revocable. All of them land in the same Loki/Prometheus/Tempo, differentiated only by service_name — so the dashboard's $service_name picker just grows a new option, with nothing about the dashboard itself needing to change. A leaked or rotated token for one system never touches another's.
The recipe
1. Pick a service_name
Kebab-case, unique across the whole stack (e.g. ollacrm-api). This is the label that separates this system's data from every other system's in every panel and every query. Treat it as stable — renaming it later splits your history in two, since every past log/metric/trace keeps the old name.
2. Create a dedicated Access Policy + token — you do this, not an agent
Grafana Cloud portal → Security → Access Policies → Create access policy (this project's stack lives under the org slug urbalurba — the maintainer's own chosen name, not a Grafana term — so that's https://grafana.com/orgs/urbalurba/access-policies). The "Create new access policy" form has these fields, confirmed against a real one:
- Display name and Name (a separate "unique identifier" field, shown right below Display name) — set both to
<service-name>-ingest(e.g.ollacrm-ingest); there's no reason for them to differ - Realms — a multi-select dropdown, not free text. Pick this one stack (e.g.
urbalurba) specifically, not "all stacks" - Scopes — a table: rows are resources (
metrics,logs,traces,profiles,alerts,rules,accesspolicies), columns areRead/Write/Deletecheckboxes. Check only Write formetrics,logs, andtraces— leave every other checkbox unchecked - Click Create access policy, then on the resulting policy card click Add token, name it to match, and copy the value immediately — it's shown once
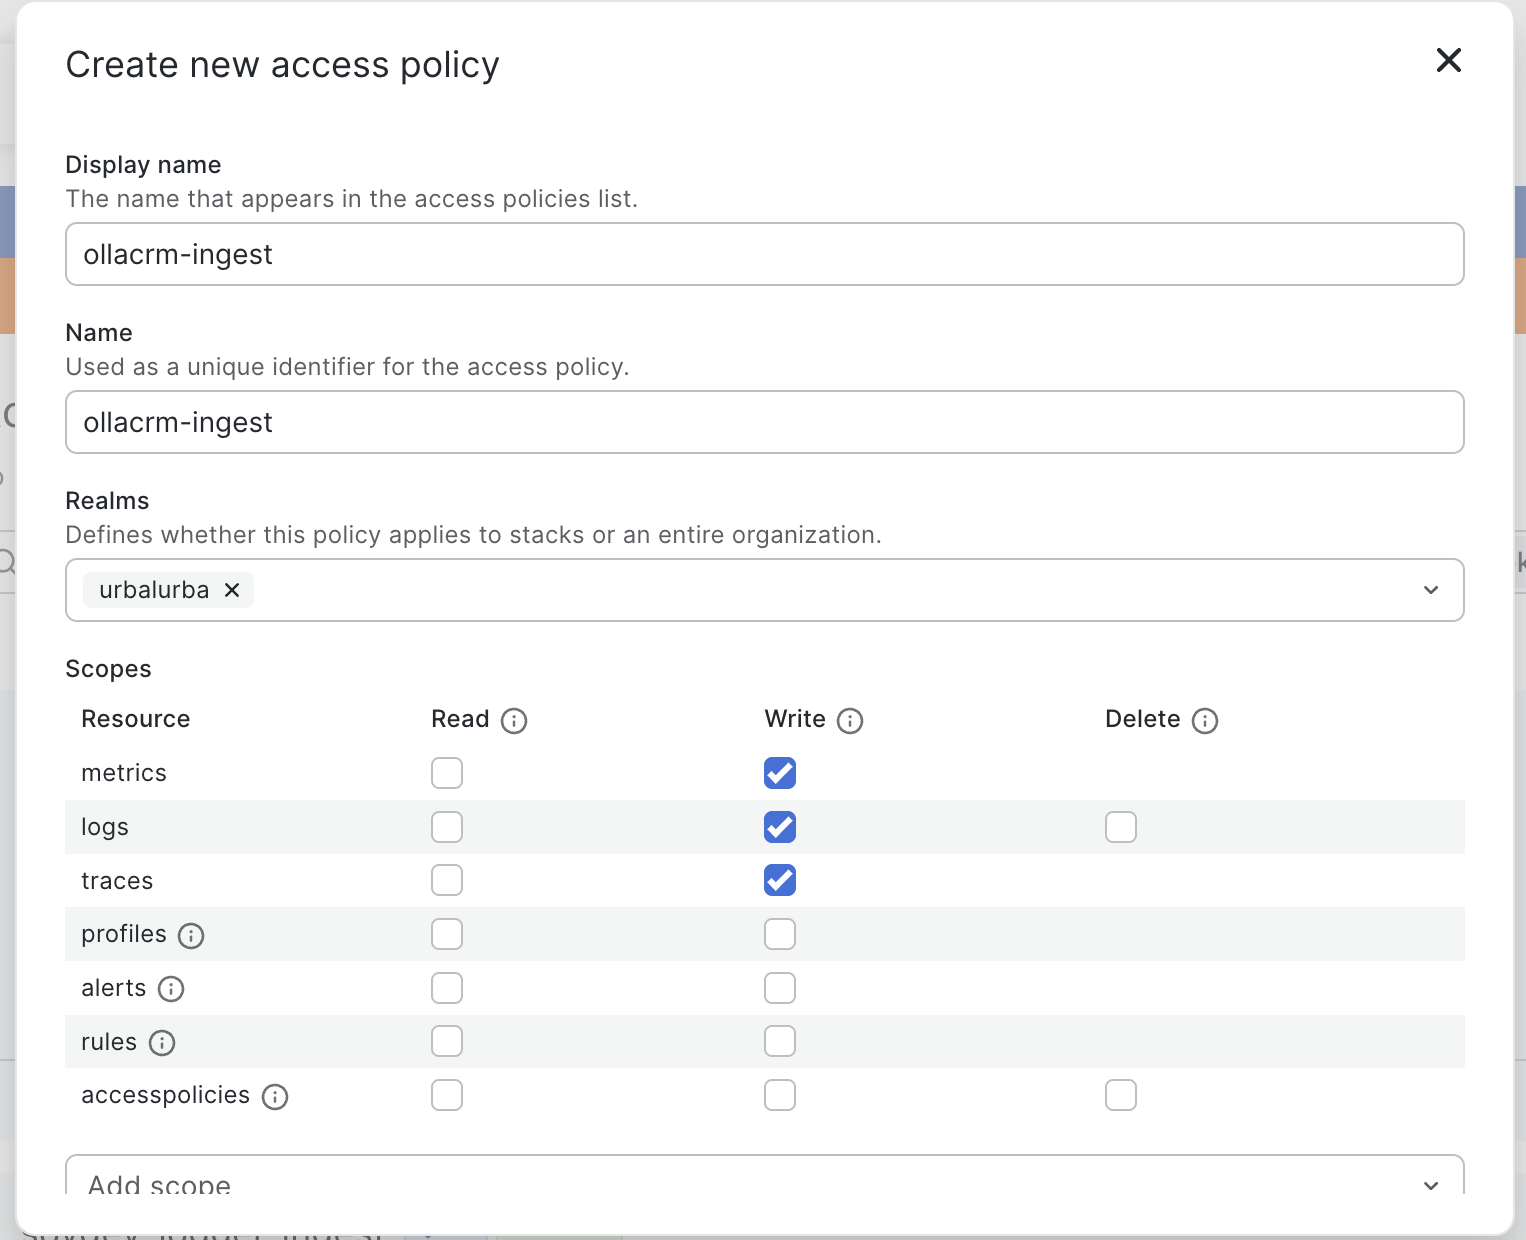
Screenshot captured 2026-07-10. This is Grafana Cloud's own UI, not something this project controls — if the form looks different when you get here, Grafana Labs has redesigned it since; follow the field descriptions above rather than the exact layout.
This step doesn't get delegated to an AI agent: minting credentials and touching access controls in the portal is a hard line this project already drew once — two separate Claude Code sessions have each independently declined to click "Create" here, even with explicit authorization.
3. Create a second Access Policy + token — read-only, scoped to just this system
This one is new as of 2026-07-14, needed to run sovdev-selftest (step 4) without handing every customer a credential that can read every other customer's data too.
Grafana Cloud portal → Security → Access Policies → Create access policy (same page as step 2 — https://grafana.com/orgs/urbalurba/access-policies):
- Display name and Name —
<service-name>-verify(e.g.ollacrm-verify) - Realms — same stack as step 2 (e.g.
urbalurba) - Scopes — check Read for
metrics,logs, andtraces. Leave Write/Delete unchecked everywhere. - Once
logsandmetricsRead are checked, a "Label selectors (0)" section appears below the scopes table (collapsed by default — click it to expand). Click Add label selector and enter:Use the regex operator (service_name=~"^<service-name>.*"=~), not exact-match (=).sovdev-selftestwrites its disposable test data under<service-name>-selftest(a suffix on the real name, so self-test runs never pollute the real dashboard) — an exact-match selector on just<service-name>won't match that, and the tool's read-back step will fail even though the write succeeded, which looks like a broken credential rather than what it actually is: a selector mismatch. Confirmed directly by hitting this exact mismatch while setting up ollacrm's own policy.- Label selectors don't cover
traces— Grafana Cloud's own UI says so directly ("Available only with read permissions for metrics and logs"). Thetraces:readcheckbox on this policy stays stack-wide regardless of the selector above — a known, accepted gap, not something to try to work around here.
- Label selectors don't cover
- Click Create access policy, then Add token on the resulting card, name it to match, and copy the value immediately — same one-time-reveal behavior as step 2. (The policy card shows "0 tokens" until you do this — the policy alone doesn't do anything without an actual token.)
4. Run onboard-system.sh — verifies the tokens and writes the handover file in one step
As of 2026-07-14, this replaces hand-finding the OTLP endpoint, hand-computing the Basic Auth header, hand-copying eight env var names, and running a separate validation step — one command does all four, and it's mechanically impossible to hand over credentials that don't actually work: the output file is only ever written by the same run that just proved these exact values pass a real write+read-back check.
cd tools/validation/grafana-cloud
cp raw-input.env.example /tmp/<service-name>-raw.env
# fill in SERVICE_NAME, INGEST_TOKEN (step 2), VERIFY_TOKEN (step 3)
./onboard-system.sh /tmp/<service-name>-raw.env /tmp/<service-name>-handover.env
It builds the library fresh, runs the real sovdev-selftest check against these exact values, and — only if all four checks (write-log, write-metric, read-log, read-metric) pass — writes the finished handover file: both the application's own OTLP env vars and sovdev-selftest's own GRAFANA_CLOUD_* vars, in one place, ready to send onward. If verification fails, the script exits non-zero and the handover file is never created — there's nothing to accidentally hand over broken. This is exactly how a real, live mistake was caught in this project: a label selector was first set up with exact-match instead of regex, and this exact check surfaced the read-back failure immediately — before anything was ever handed to anyone.
The stack-wide constants (OTLP/Loki/Prometheus/Tempo endpoints and Instance IDs — each genuinely different from the others, confirmed non-uniform, don't assume a shared pattern) are filled in automatically; they're the same for every system on this stack. Only override them (see raw-input.env.example's OVERRIDE_* fields) if this system is ever on a genuinely different stack.
5. Treat every credential as a real secret
The handover file onboard-system.sh just produced contains real credentials (OTEL_EXPORTER_OTLP_HEADERS, GRAFANA_CLOUD_INGEST_TOKEN, GRAFANA_CLOUD_VERIFY_TOKEN). Send the whole file to whoever owns the new system's deploy through a secure channel — never in plain chat or email. Once there, they split it the same way every system does: the token-bearing lines go wherever their own deploy pipeline keeps real secrets; the plain identifiers (OTEL_SERVICE_NAME, the various *_URL/*_INSTANCE_ID values) can live as ordinary env vars/config.
6. Verify it shows up in the real system
Once the new system is actually wired up (not the disposable -selftest data from step 4) and has generated at least one real log call, open the dashboard — the new service_name appears automatically in the $service_name picker (multi-select, "All" selected by default) and in every panel's legend. Nothing about the dashboard changes: this is exactly what its template variable and per-peer-service panels were built for. See Dashboard walkthrough for what each panel means once you're looking at it.
What you're not doing
- Not creating a new dashboard — the existing one already generalizes to any number of services.
- Not creating a new Grafana Cloud stack — one stack, one retention budget, one place to look.
- Not sharing a credential across systems — every system gets its own independently-revocable token, so a leaked token doesn't hand over every system's credentials at once. This contains read access only (each system's verify token is LBAC-scoped to just its own
service_name, confirmed directly) — it does not prevent a leaked ingest token from writing fabricated data under a different system'sservice_name. Grafana Cloud's Label-Based Access Control only restricts read scopes, never write scopes (confirmed directly — see Testing against Grafana Cloud's "Known limitation: write tokens aren't service_name-restricted"). Treat every ingest token as capable of writing anywhere in the shared stack if it leaks, not just its own system.
Experience reports
Real systems that have gone through this recipe, with the exact snippets that made it concrete:
- ollacrm — a TypeScript/Hono service on Cloud Run, sovdev-logger's first external consumer. See also its logging conventions — real field-mapping and log-level patterns across ~90 production call sites.
See also
- Why Consistent Logging Across Systems — the philosophy behind this recipe
- Dashboard walkthrough — what each panel shows once data arrives
- Observability architecture — the local-UIS side of dashboard setup
- Testing against Grafana Cloud — how sovdev-logger's own E2E tests use this same stack, for verification rather than a production system
- Quick check: sovdev-selftest — the CLI
onboard-system.shruns internally in step 4, and the full design behind it